
Most companies selling to small and midsize businesses do not have a market-size problem. They have a market-truth problem.
There are always more records available. Another provider can sell you another list of restaurants, retailers, medical practices, contractors, merchants, franchisees, ecommerce sellers, or local service businesses. The hard part is determining which of those businesses exist in a meaningful way today, which ones are healthy enough to buy, and which ones your sales team can actually reach.
That distinction matters because down-market inefficiency compounds quickly. A questionable account does not just create one bad record. It can consume enrichment spend, ad budget, SDR capacity, routing logic, automated touches, and management attention before anyone realizes the business was never a viable prospect.
Finding more SMBs is easy. Knowing which ones deserve sales capacity is the real competitive advantage. LeadGenius point of view
A large TAM can hide a small sellable market
Traditional market maps tend to lean heavily on employee counts, modeled revenue ranges, broad industry codes, and static business listings. Those fields can be useful starting points. Down-market, however, they are often too blunt to answer the questions that revenue teams actually care about.
Is the business open? Is the website valid? Is it adding locations or quietly contracting? Is commercial activity moving in the right direction? Has it adopted technology that makes it a better fit? Is it hiring? Can you identify the owner, operator, or functional buyer? Does your team have a reason to engage now?
If your system cannot answer those questions, the apparent size of the database becomes a distraction. Coverage is not the number of records you own. Coverage is the percentage of your real market that you can accurately qualify, reach, and put into motion.
What the Down-Market Data Stress Test evaluates
The assessment starts with a sample of 500 to 1,000 accounts from your CRM, territory, or target market. LeadGenius evaluates that sample using real-time research and market-specific logic. The goal is not to sell you back your own records. It is to reveal how much of your current market is genuinely workable and which signals would improve qualification.
Operating status
Determine whether each business appears active, inactive, closed, dormant, or uncertain.
Website and location validity
Validate digital presence, physical locations, location changes, and account-to-domain alignment.
Commercial activity
Compare modeled assumptions with observable indicators of real business activity.
Growth or contraction
Surface momentum that can separate promising accounts from businesses moving backward.
Location expansion
Identify openings, added locations, geographic expansion, and changes in operational footprint.
Hiring activity
Use hiring volume, role mix, and strategic hires as evidence of investment and changing needs.
Onsite technologies
Detect relevant platforms and tools that indicate fit, readiness, displacement, or integration potential.
Ecommerce and transaction signals
Use observable commerce behavior to add context that static firmographics cannot provide.
Decision-maker coverage
Measure whether qualified accounts include the owners, operators, and functional leaders sales needs.
Entity and duplicate risk
Find duplicated records, mismatched domains, incorrect hierarchies, and improperly mapped businesses.
How the assessment works
Choose a representative sample
Provide 500 to 1,000 accounts from a territory, campaign audience, market segment, or CRM cohort that matters to the business.
Define what qualified means
We align the analysis to your customer profile, sales motion, relevant buying roles, and the operational signals that should influence prioritization.
Evaluate the market in real time
LeadGenius validates accounts, looks for meaningful business activity, assesses contact coverage, and identifies records that require suppression or correction.
Turn findings into a GTM decision
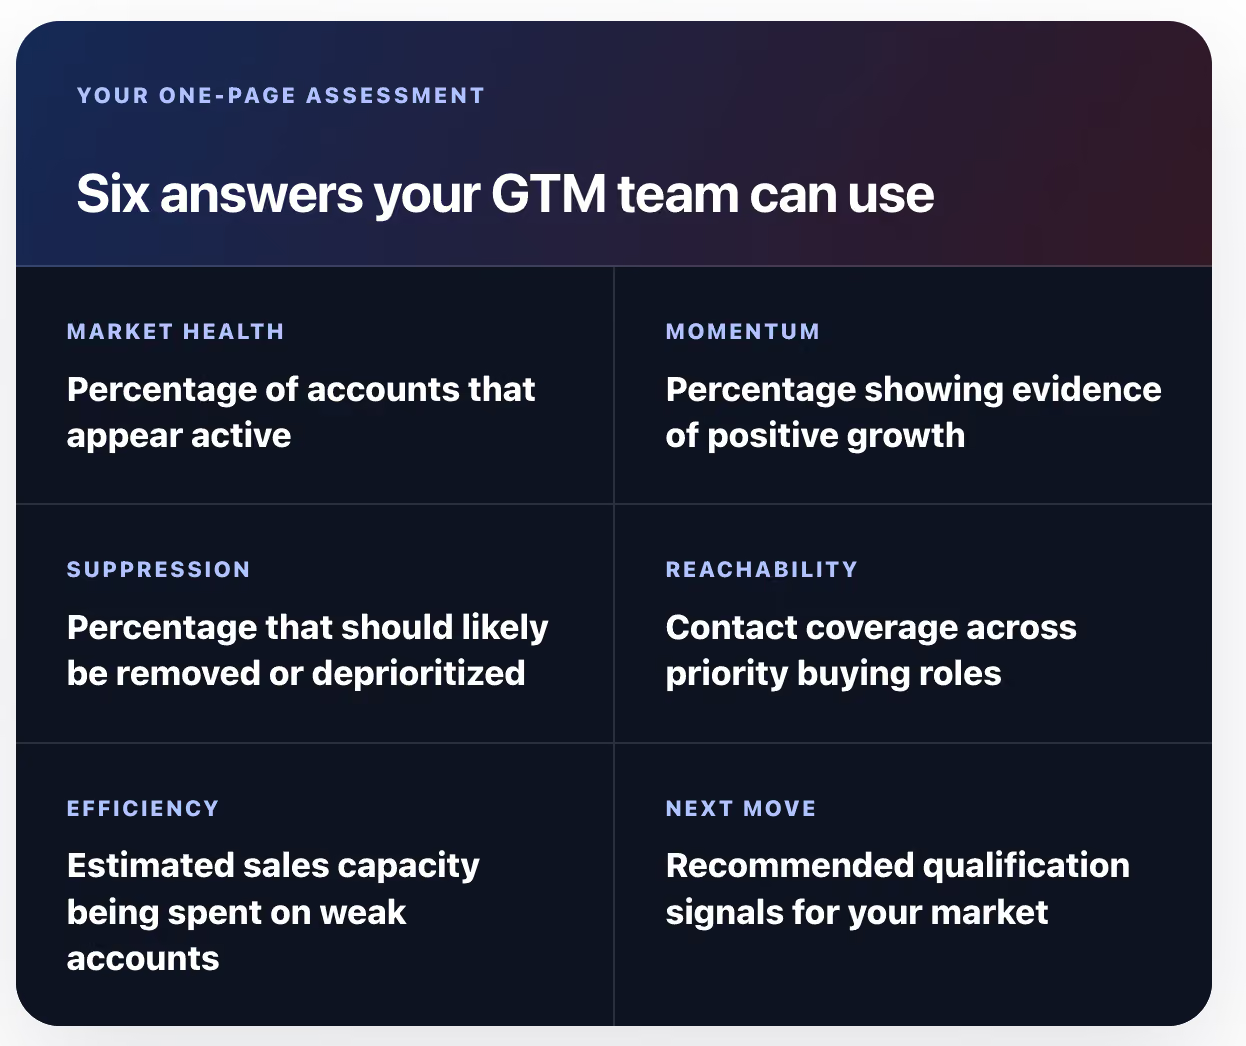
You receive a one-page scorecard and recommendations for improving the audience, territory, qualification rules, and handoff to sales.
What you receive
The scorecard is designed to make a market-quality conversation concrete. Instead of debating whether the database is “good,” your team can see where coverage breaks, how much noise reaches sellers, and which signals would materially improve the system.
Your one-page assessment
Six answers your GTM team can use
The real goal is sales trust
Lead generation fails when the metric being optimized is the number of leads created rather than the number sales is willing to work. Every weak account passed to a seller makes the next handoff less credible. Eventually, sales stops treating marketing-generated demand as a source of opportunity and starts treating it as another queue to clean.
A better system does more than enrich records. It suppresses noise, prioritizes real businesses, fills the buying-role gaps that block outreach, and gives sellers context for why an account deserves attention now.
| Static market approach | Sellable-market approach |
|---|---|
| Count every record in the TAM | Separate active accounts from market noise |
| Rely on broad revenue and employee bands | Use market-specific evidence of activity and momentum |
| Assign accounts before validating them | Validate, score, suppress, and then route |
| Measure raw contact volume | Measure coverage of the people who can actually buy |
| Ask sales to research every gap | Deliver context with the account and contact |
One assessment, three operational views
Improve the system
Expose duplicate records, bad routing inputs, coverage gaps, suppression needs, and qualification rules that need to change.
Improve the audience
Build campaigns around businesses with real activity and relevant signals instead of paying to reach every record available.
Protect seller capacity
Give representatives fewer weak accounts, better coverage of decision-makers, and a clearer reason to prioritize each lead.
A diagnostic layer, not another database
The purpose of the stress test is not to argue that your team needs a larger pile of data. It is to examine whether the data already driving your territories, campaigns, scoring models, and sales workflows reflects the market as it exists now.
LeadGenius acts as an independent diagnostic and data-curation layer. The analysis begins with the business question, not a prebuilt database schema. That makes it possible to define qualification using the signals that matter for your specific market, whether you sell to restaurants, independent retailers, local service providers, ecommerce merchants, healthcare practices, franchises, or another difficult-to-map SMB segment.
The result is a more honest market map. Marketing can focus spend. Revenue Operations can build better rules. Sales can trust that a lead represents a real business, a plausible buyer, and a legitimate reason to engage.
Frequently asked questions
What data do we need to provide?
A representative sample of 500 to 1,000 accounts is the usual starting point. That can come from a CRM cohort, named-account list, territory, campaign audience, or a target market you are evaluating.
Is this only a CRM hygiene assessment?
No. Hygiene is one part of the analysis. The broader goal is to evaluate operating status, business activity, momentum, fit, buying-role coverage, and the signals that should guide prioritization.
What happens after the scorecard?
If the findings reveal a meaningful opportunity, LeadGenius can help scope a specific territory, audience, campaign, or market-building program. The assessment is designed to make that next decision clearer, not to force a generic product demo.
Can the analysis reflect our unique definition of a qualified SMB?
Yes. The evaluation is most useful when qualification reflects your actual sales motion, strongest customer profiles, target geographies, buying roles, and relevant operational signals.
.avif)