
There is a useful gap between what a startup says it is doing and what its paid-media footprint shows it is actually doing. Press releases are free. Fundraising announcements are stage-managed. But a sustained, multi-channel advertising operation costs real money, takes real headcount, and is one of the cleanest signals available that a company is genuinely trying to grow — or has quietly stopped trying.
We ran the full Y Combinator alumni list — 5,906 companies across 21 years of batches — through ad-intelligence APIs across LinkedIn, Meta, and Google. We pulled every live and recent ad we could find, totaled the volume by company, compared it to the same exercise we ran in September 2025, and ranked everything from Super Heavyweight down to Dormant.
The picture that emerged is sharper than the standard "winners and losers" narrative about YC. It identifies the companies that are genuinely scaling demand right now, the ones that have quietly cut their ad spend, the breakouts almost nobody is talking about, and the long tail of YC alumni — almost two-thirds of the network — that have effectively stopped advertising at all.
This is what the ad data says.
Each YC company classified by total live ad volume across LinkedIn, Meta, and Google. The Dormant tier — companies running zero detectable ads — is the modal outcome.
Only 81 YC companies — 1.4% of the network — qualify as Heavyweight or Super Heavyweight.
Together with the 117 Light Heavyweights, just 198 companies — 3.4% of the alumni network — account for the overwhelming majority of paid-media activity across the entire YC ecosystem.
01 The 81 who actually advertise
If you sell into the YC alumni network — and many B2B vendors do, because it concentrates buyers in software, fintech, infrastructure, and HR tech — your real addressable market is far smaller than the alumni count suggests. Most YC companies are not paid-acquiring customers, partners, or hires. Most YC companies are not, in any meaningful sense, marketing themselves at all.
The 81 companies in the Heavyweight and Super Heavyweight tiers run sustained, multi-channel advertising operations. They are paying meaningful money to platform ad networks every month. They are the ones whose names a media planner needs on a watchlist, and whose buying patterns reveal where the venture-backed economy is genuinely investing right now.
The top of the list contains some surprises.
Total live and recent ads across LinkedIn, Meta, and Google. A handful of companies dwarf everyone else.
A few observations worth pulling out of that ranking.
First, Lattice — the HR performance platform — has quietly become one of the largest paid advertisers in the entire YC universe, with more than 200,000 live ads, almost all on LinkedIn. Its volume is now neck-and-neck with Airbnb's. Lattice operates in one of the most saturated SaaS categories in the world (BambooHR, Workday, 15Five, Culture Amp, ADP, et al.), and its response has been to outspend nearly everyone on professional-network media.
Second, Airbnb is cutting. Its ad volume dropped from 302,770 ads in September 2025 to 201,331 today — a 34% reduction in roughly six months. That is the single largest absolute decline in the entire dataset. We will come back to this.
Third, acquired companies are running heavy paid media. Bizzy, Soomgo, and Segment all sit in the top 15 — but each has been absorbed into a larger acquirer. Their continued ad operations are evidence that being "acquired" is rarely the end of a brand's life. The acquirer keeps the marketing pipeline running. For media planners and competitive-intel teams, this is a useful reminder that an exit does not remove a company from the buying landscape.
Fourth, the much-loved canonical YC names — Stripe, DoorDash, Faire, Deel, Rippling — are all there, but they are not running away with it. Stripe, often described as the most valuable private company in the world, places fifteenth by live ad volume. Stripe's growth is driven by API-led, developer-driven distribution; paid media is a smaller share of its mix than the rankings might suggest.
The biggest YC advertiser is one you've never heard of
TypeLess sits at #1 by raw ad volume with more than 304,000 ads — a figure roughly equal to Airbnb and Lattice combined. The company had effectively zero ads in our September 2025 snapshot. A spike of this magnitude in a six-month window is almost always one of three things: a programmatic display campaign that generates enormous creative variants, an aggressive launch push for a new product, or a category-spam strategy designed to dominate share-of-voice. Either way, it is the clearest example in the dataset of how paid-media volume can identify breakouts the press has not yet noticed.
02 The biggest gainers since September 2025
Total ad volume across the YC alumni network has grown by more than 500,000 ads in the past six months. 1,196 companies increased their spend. 825 cut it. The rest were unchanged or remained dormant.
But the gains are wildly uneven. A small number of companies are responsible for the majority of the growth.
Companies that had a meaningful paid-media baseline in September 2025 and have scaled aggressively since.
A pattern jumps out of this list. Many of the fastest-growing ad operations cluster in a small number of categories. HR-tech and people platforms are leaning into LinkedIn (Lattice, Rippling). AI-adjacent productivity and creative tools are pouring money into Google search and display (Photoroom, Replit, Retool, Speak). Consumer marketplaces are still buying on Google as well (DoorDash, Paribus).
Three of these — Photoroom, Speak, and Replit — are AI-native businesses founded in the last several YC batches. Their advertising acceleration is the clearest paid-media signal in the dataset that the AI application layer is no longer just an engineering story; it is becoming a demand-generation story too. When AI-native companies start outspending traditional SaaS competitors on Google and LinkedIn, the implication for incumbent vendors is not subtle.
03 The power law inside the power law
Venture capital is governed by a power law: a small number of investments return the majority of the value. Less appreciated is that paid media follows the same shape — and the curve is even steeper.
Out of 5,906 YC alumni:
What share of the entire 1.52 million-ad YC universe is controlled by the top N spenders.
If a sales or media team treats "YC alumni" as a target segment, they are implicitly treating 5,906 companies as roughly equivalent prospects. The data says that is wrong by orders of magnitude. 100 companies control 87.5% of the buying signal. The remaining 5,800+ are mostly noise — small, dormant, or pre-product.
This concentration is not theoretical. It is operationally consequential. A B2B vendor selling marketing tools to YC companies will get virtually all of its serviceable demand from the top three or four hundred names. A media-intelligence team mapping competitive ad spend will find that watching the top fifty captures the overwhelming majority of the signal. A recruiter targeting growth-stage YC startups looking for paid-acquisition leadership will find that the candidate pool is bounded by the same hundred-odd companies that are doing the spending.
Treating the YC alumni list as a flat population is a category error. The list is a power-law distribution, and almost everyone who matters sits in the long head.
04 The biggest decliners: who is pulling back
An ad-spend cut is not always a loss. It can mean a company has improved efficiency, found organic distribution that scales, or paused while it rebuilds. But when a company that was running tens of thousands of live ads suddenly halves that number, something has changed. Either the unit economics stopped working, the strategy shifted, or the budget was redirected somewhere we cannot see.
The decliners list reveals at least three distinct patterns.
Absolute decline in live ad count between snapshots.
Pattern one: the mature public companies are getting more efficient. Airbnb (−34%), Dropbox (−43%), and DoorDash's stablemates have all spent the past six months trimming. The public-company dynamic is consistent. Once a business needs to defend gross margins for the quarterly call, the easiest line to cut is paid media — especially the long-tail of low-converting display and retargeting variants. A 34% cut at Airbnb is not a sign of decline; it is a sign of a mature growth engine optimizing.
Pattern two: HR-tech has bifurcated. Lattice is pouring money in. Deel is pulling back. Rippling is increasing. These three are direct competitors in adjacent HR/payroll/compliance categories, and they are now placing very different bets on how much of their growth needs to come from paid LinkedIn. Whichever approach turns out to be right will define the category leader for the next several years.
Pattern three: emerging-market consumer plays are tightening. Zepto (−86%) and Meesho (−14%) are both Indian consumer marketplaces. After years of paid-media-fueled growth, both appear to be reining in CAC. This is the part of the dataset that points to the broader VC trend: emerging-market consumer companies are being pushed toward profitability faster than their U.S. peers were a decade ago.
From 20,000 ads to 200 in six months
A 99% drop in ad activity is not optimization. It is one of three things: the company has stopped trying to grow, the platform has stopped accepting their ads, or the business has effectively been wound down operationally without a public announcement. This kind of paid-media collapse often precedes more visible signs of distress by months. Ad-volume change is one of the earliest leading indicators of company health that exists outside the company itself.
05 The channel war: where YC actually spends
Across all 5,906 YC alumni, the channel split is striking. Of the 1.52 million live ads we counted, the overwhelming majority are running on Google or LinkedIn. Meta is a distant third.
Counted across the full 5,906-company YC alumni network.
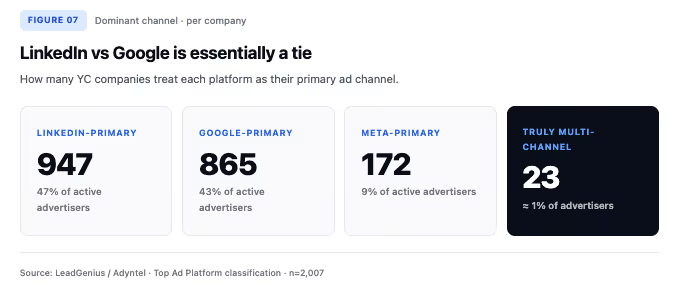
The bigger story is not just the volume split — it is the company-by-company preference. Looking at which platform each of YC's 2,013 active advertisers treats as its dominant channel:
How many YC companies treat each platform as their primary ad channel.
Two things stand out.
First, LinkedIn has caught Google. The fact that more YC companies use LinkedIn than Google as their primary channel is a quietly important shift. A decade ago this would have been unthinkable; Google Search was the default growth engine for the entire startup ecosystem. The mix has flipped because the modal YC company is now B2B SaaS targeting other companies, and LinkedIn is structurally better at reaching that audience.
Second, Meta has lost the startup audience. Only 9% of YC advertisers treat Meta as primary, almost all of them consumer or D2C. The combination of iOS attribution loss, signal degradation, and audience-targeting restrictions has pushed B2B startups off of Meta almost entirely. For a platform that once dominated venture-backed growth marketing, this is a substantial structural change. Meta's remaining YC stronghold is emerging-market consumer commerce (Meesho is by far its biggest YC advertiser).
Third, almost no one is genuinely multi-channel. Only 23 companies — about 1% of active advertisers — run meaningfully balanced campaigns across two or more platforms. The vast majority pick one channel and concentrate. For most YC startups, paid media is not an integrated stack; it is a single bet.
06 Where the money goes by industry
Aggregating spend by industry reveals which sectors of the YC portfolio are competing hardest for attention. The leaderboard is not what most readers would predict.
Total live ads, summed across all YC companies in each industry category.
Human Resources is the single largest spending industry in the entire YC portfolio. That is a non-obvious result. HR-tech is a smaller category than Engineering, Product & Design in terms of company count — 85 HR companies versus 618 engineering-tooling companies — but the HR cohort spends more than five times what the engineering cohort spends on paid media.
This is the clearest sectoral signal in the dataset. HR has more vendor competition, more direct buyer demand, more sustained budget approval cycles, and more reliance on paid LinkedIn as a sales channel. The category is also unusually homogeneous: nearly every HR-tech company is selling a similar product (people-platform-with-payroll-and-comp) to a similar buyer (the head of People at a mid-market company). That homogeneity forces differentiation through spend.
By contrast, Engineering-Product-Design tools — Linear, Notion, Figma-adjacent, and the long tail of developer infra — are far more likely to grow through bottom-up adoption, content, and developer-relations programs. They show up in our dataset because they exist, not because they are pouring money into ad networks.
07 The dormant tail: 3,893 silent companies
If the top of the curve is sharp, the bottom is vast. 3,893 of YC's 5,906 companies — 66% — run zero detectable ads across LinkedIn, Meta, and Google.
There are three honest categories inside that 3,893:
For a media planner or a B2B sales team, the practical takeaway is that the dormant tail should not be addressed the way the heavyweight head should be. The dormant tail is where most YC companies actually live — but it is also where almost none of the actionable buying signal lives. A targeting strategy built on logo-affiliation ("they're a YC company") will, on average, hit a non-buyer 65% of the time.
08 What the paid-media data actually tells us
Pulling back from the individual companies, four conclusions are worth sitting with.
1. Ad volume is one of the cleanest health signals you can get on a private company.
It is observable, weekly-frequency, channel-agnostic, and largely outside the company's control to manipulate. A sustained increase in ad volume is a strong leading indicator of revenue ambition. A sustained decrease is, in most cases, a leading indicator of efficiency pressure or trouble. YourMechanic going from 20,000 ads to 200 is the data noticing something the press releases haven't covered yet.
2. HR-tech is the single most competitive paid-media category in venture right now.
More YC companies are spending more money in HR than in any other sector — and within HR, three direct competitors (Lattice, Rippling, Deel) are making divergent bets that will define the category for the next several years. Anyone selling into or building in the HR-tech space should treat this as a structural data point, not a one-quarter anomaly.
3. The B2B paid-media stack has flipped to LinkedIn-primary.
For a decade, Google Search was the assumed answer to "where do startups buy growth." That has changed. More YC companies now use LinkedIn as their primary channel than Google. Meta has been pushed almost entirely to consumer and emerging-market use cases. The implications run far beyond YC: this is what the future of B2B media planning looks like for any vendor whose buyer sits at a desk.
4. The list is not the market.
The single most important number in this entire analysis is 87.5% — the share of all YC paid-media activity controlled by just 100 companies. Any go-to-market plan that treats "YC alumni" as a coherent target list will mis-allocate effort by an order of magnitude. The right approach is to use observed behavior — who is advertising, how much, on which channel, and whether they're scaling or cutting — to identify the small subset of the network that is actually a live buyer right now.
That is the difference between firmographic targeting and behavioral targeting. The first asks who they are. The second asks what they're doing. In a market where two-thirds of any given list is dormant, the second question is the one that actually matters.
Find the 81. Skip the 3,893.
LeadGenius combines AI with human-in-the-loop research to deliver custom B2B intelligence — verified contacts, account signals, and behavioral data across global markets. The YC ad-spend analysis behind this article is the kind of enriched, on-demand intelligence we build for revenue teams every day. Identify the companies actually buying, on the channels they actually use, with the spend velocity that actually predicts demand.
.avif)