1. We Start With the Team’s Product-Level ICP
Before any modeling happens, LG aligns on the actual product motion for that sales team — not a generic “developer” segment.
We capture attributes such as:
- Required skills to deploy or integrate their product
- Adjacent technologies or frameworks that commonly co-exist with the solution
- Typical seniority, titles, or functions who evaluate, buy, and implement
- Industry verticals where adoption historically performs best
This becomes the Product-Specific Skill Graph, our baseline for everything else.
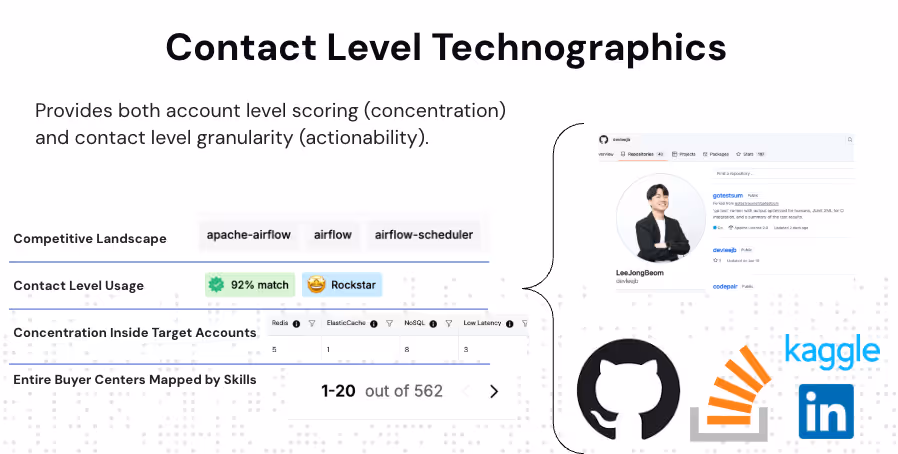
2. We Map That Skill Graph Against Global Developer Signals
This is where the bespoke magic happens — and where ZoomInfo/Apollo simply can’t compete.
Using our continuously updated corpus of 60M+ developers and engineers, LG runs the product’s skill graph against real-world activity from three primary sources:
GitHub
- ML reads commit logs across 300M repositories
- We infer skills based on actual contributions
- We measure depth via:
- Recency
- Frequency
- Length of time practicing a skill
- Complexity of the work (file changes, code ownership patterns)
- Job titles, roles, tool stacks
- Endorsements, listed skills, project summaries
- Promotion velocity and seniority (signals of influence)
Stack Overflow / Kaggle
- Q&A activity
- Topic expertise
- Engagement depth (helping, answering, solving)
This cross-source fusion lets us identify who actually uses a technology, not who merely claims to.
3. We Roll Usage Up to the Account Level
Each developer signal is matched to their employer using:
- Contact-level emails
- Domain verification
- Onsite technology fingerprints
- Public company metadata
- Multi-source identity stitching
That gives you a company-level view of:
- Count of developers using skills essential to your product
- Relative density vs. company size (usage intensity)
- Trend lines (is adoption rising or falling?)
- Geographic distribution (helpful for territory planning)
This is why LG beats static databases — we’re not inferring usage from job titles; we’re deriving it from real behavioral activity.
4. We Tailor Density Maps for Each Sales Team’s Motion
Because each product team has unique needs — different buyers, different integrations, different technical dependencies — LG customizes each density map.
Examples:
For a DevOps tooling sales team
We map usage of: Kubernetes, Terraform, Docker, Jenkins, GitLab runners, etc.
For a data engineering product
We map: Airflow, dbt, Spark, Databricks, Python proficiency, ML pipelines.
For an API-first workflow platform
We map: REST usage, GraphQL, serverless patterns, Node/Python/Go activity.
We’re not giving a one-size-fits-all “developer profile.”
We’re giving a product-correlated adoption map.
5. The Output: A Usage Density Map That Tells the Sales Team Where to Go First
Each salesleader ends up with:
- Accounts ranked by real usage intensity
- Signals that match their product’s adoption requirements
- Regional/territory breakouts
- A list of the specific developers influencing the toolchain
- Contactability (emails, phones, LinkedIn URLs) for those developers
This is how we help Marketing prioritize campaigns, RevOps optimize TAM, and Sales focus on accounts that actually show propensity to adopt.