It’s Q4 — annual-planning season — that time when every GTM leader leans back, squints at a spreadsheet, and declares:
“We know our market.”
Except, of course, they don’t.
Because what most teams have isn’t a market map — it’s a PowerPoint fiction. A universe carved by NAICS codes, employee-count buckets, and the lazy shorthand of “mid-market” and “enterprise.” The kind of abstractions that feel data-driven until you try to build pipeline from them.
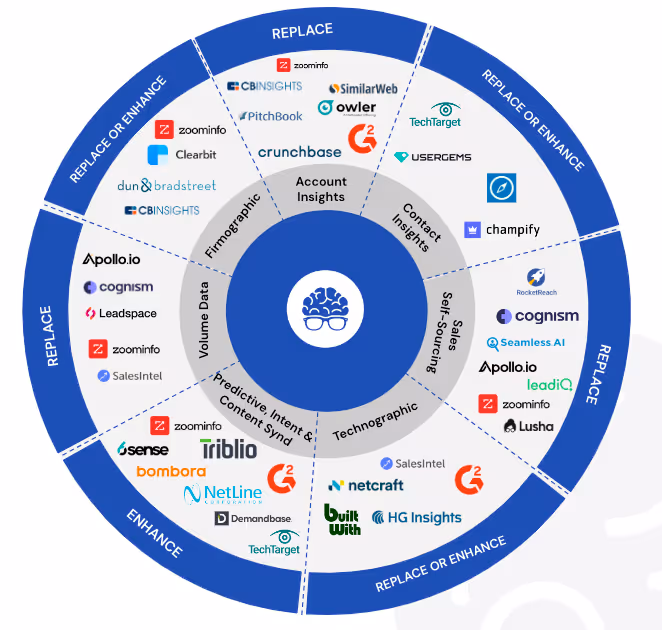
Static tools like ZoomInfo and Cognism made this mistake feel inevitable. They offer the comfort of the known: picklists, filters, and frozen definitions of “industry.” But in a world where every buyer is bombarded, where attention and budget are scarce, that’s not precision — it’s blindness.
The future of market mapping — and of GTM strategy — is microsegmentation: a move from broad categories to bespoke data. A shift from counting companies to understanding signals of intent, capability, and context.
Beyond Picklists: How Bespoke Data Changes the Game
The problem with most market maps is that they’re built around inputs that don’t actually predict behavior.
You can have two software firms with 500 employees — one doing $50 million in ARR with a product-led motion, the other a bootstrapped agency with a custom dev shop. Same employee count. Entirely different markets.
Real segmentation happens when you stop asking how big a company is and start asking how it behaves.
- Transaction volume vs. revenue tells you how fast money moves through a business — a truer signal of operational scale.
- Number of engineers using SQL tells you where data literacy lives — a proxy for technical readiness and product compatibility.
- Whether a law office offers estate planning isn’t trivia; it’s the difference between targeting consumer-facing vs. corporate clientele — a complete rewrite of your value proposition.
That’s what bespoke data gives you: context. The ability to say, “Our ICP isn’t every 100-500 employee SaaS company.” It’s “B2B SaaS firms with high API exposure, rapid hiring in data engineering, and a spike in product-led activation metrics.”
That’s not segmentation. That’s pattern recognition — and it’s the future of go-to-market.
Market Mapping as Inquiry, Not Inventory
A real market map isn’t a database. It’s an argument.
It answers, with data, the two most existential GTM questions:
- Where do we play?
- How do we win?
At LeadGenius, we think about this in two levels.
Level 1: Markets
These are the macro playing fields — by business unit, region, or product line. They give you structure but not strategy.
Level 2: Segments & Tiers
This is where the art begins.
You cluster accounts not by industry tags but by shared behavior, shared pressures, and shared potential.
That’s microsegmentation.
Then, within each microsegment, you rank opportunity by fit, timing, and density of buying signals. The result isn’t a static list; it’s a living model of where your GTM energy compounds.
The ROI of Precision
When PartnerStack’s Tyler Calder built his 40-signal market map, the results weren’t subtle:
A 34 percent drop in cost per dollar of pipeline.
A 58 percent increase in total pipeline value.
Why? Because the math of GTM follows the math of markets: specificity compounds.
Every SDR hour, every ad dollar, every campaign performs better when pointed at the right clusters.
The wrong map isn’t just inefficient — it’s expensive.
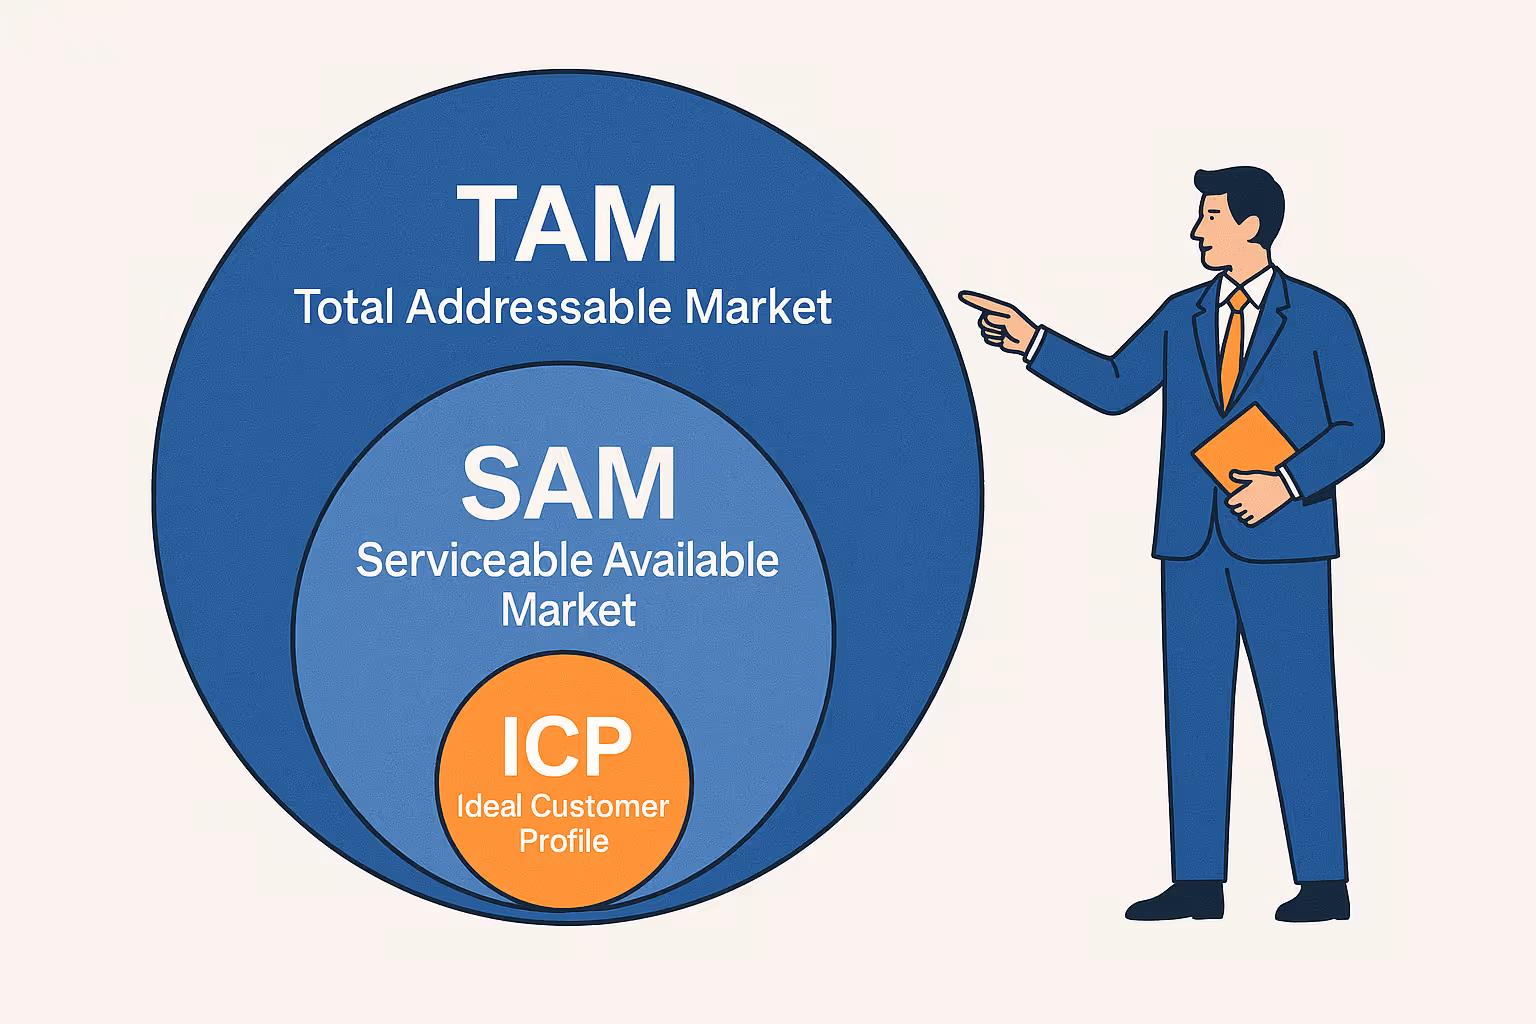
From TAM to SAM to Truth
Here’s a heresy worth repeating: TAM is for investors. SAM is for operators. ICP is for builders.
Your total addressable market (TAM) tells a story of scale — but not of likelihood.
Your serviceable addressable market (SAM) gets closer — but only if you define it with custom insight, not canned filters.
And your ICP? That’s your blueprint for replication — the pattern of customers who not only buy, but stay, expand, and advocate.
Building your SAM and ICP from bespoke data — not static lists — is how you move from guessing to knowing.
From broad to narrow. From generic to generative.
How to Build Your 2026 Market Map
- Redefine your variables. Replace industry codes with behavioral or contextual metrics — things that predict success.
Example: “Companies with active GitHub repos in Python and Airflow” outperforms “Software, 200–1000 employees” every time. - Segment by reality, not by record. Group accounts by situation — funding stage, product maturity, hiring velocity, geographic expansion — not just firmographic similarity.
- Tier dynamically. A/B/C tiers aren’t about headcount; they’re about signal density. A small firm with 12 engineers using Snowflake might be a higher-probability buyer than a 500-person enterprise with none.
- Allocate like an investor. Once the map is built, distribute resources based on expected return — not historical comfort.
A Program, Not a Project
Markets move. Buyers evolve. The company you sold to last year might be irrelevant next year.
Market mapping should be iterative — built, tested, and recalibrated continuously.
Think of it as an annual operating system for focus:
- Build in Q4.
- Test in Q1.
- Adjust in Q2–Q3.
- Rebuild in Q4.
Why This Matters Now
We’re entering 2026 planning season, and most companies will do what they always do: set a top-down number, distribute it evenly, and hope focus emerges from activity.
The winners won’t.
They’ll pick their spots.
They’ll map their real SAM, define their true ICP, and build campaigns around microsegments that actually buy.
Market mapping isn’t sexy. But it’s strategy in its purest form — the art of deciding where to place your bets when the board is too big and the clock is ticking.
And in this era of noise, attention, and data overload, the only unfair advantage left is clarity.