We recently ran an AdGenius Performance Blueprint for a mid-market hospitality SaaS company — a restaurant operations platform selling scheduling, inventory, and POS integrations to independent restaurants and small chains. They were spending $15K a month on paid media and generating 14 demo requests. The team believed they had a volume problem. They were wrong. They had a channel problem.
Their buyers — restaurant owners, multi-unit operators, and kitchen managers — were not spending their days on LinkedIn. But that is where 72% of the ad budget was going.
What We Found When We Connected Everything
Problem #1: LinkedIn was the wrong channel for this buyer.
The company was spending $10,800 a month on LinkedIn targeting restaurant owners and operations managers. LinkedIn CPMs for this audience were running at $95 — because every restaurant SaaS company from Toast to SpotOn to 7shifts is bidding on the same thin hospitality audience on a platform that most restaurant owners barely use.
When we pulled the pixel data and cross-referenced with visitor intelligence, we found that only 8% of their identified site visitors had LinkedIn profiles that matched their ad targeting. The other 92% were arriving through Google search, direct traffic, referrals from restaurant industry sites, and — critically — Facebook and Instagram referrals that were not being tracked or invested in.
The company was advertising to restaurant owners on the one platform where restaurant owners spend the least time.
Problem #2: Google was fighting Toast and SpotOn on impossible keywords.
The $3K Google Search budget was going to head terms like "restaurant scheduling software" and "restaurant POS system" — keywords where Toast, SpotOn, Square, and TouchBistro were all competing with much larger budgets. CPCs were $22–$38 on these terms. The company was getting clicks but paying over $900 per demo from Google alone.
Meanwhile, long-tail terms around their specific use case — "kitchen inventory management for independent restaurants," "employee scheduling app for small restaurant," "food cost tracking software" — had a fraction of the competition and dramatically higher purchase intent. Nobody on the team had tested below the first layer of keyword research.
Problem #3: 64 demo-page visitors disappeared every month.
Restaurant operators visited the demo page and left.
These were owners and managers who navigated through features, pricing, and integrations — all the way to the demo form. They were actively evaluating. No retargeting followed them. No outreach triggered. Without visitor identification, they were just a bounce rate statistic.
In hospitality, this matters even more than in typical B2B SaaS. A restaurant owner evaluating software is doing it between dinner rushes, on their phone, often late at night. They land on your demo page, get interrupted, and never come back — unless you follow up on the channels where they actually spend time. That means Facebook, Instagram, and YouTube retargeting, not LinkedIn InMail.
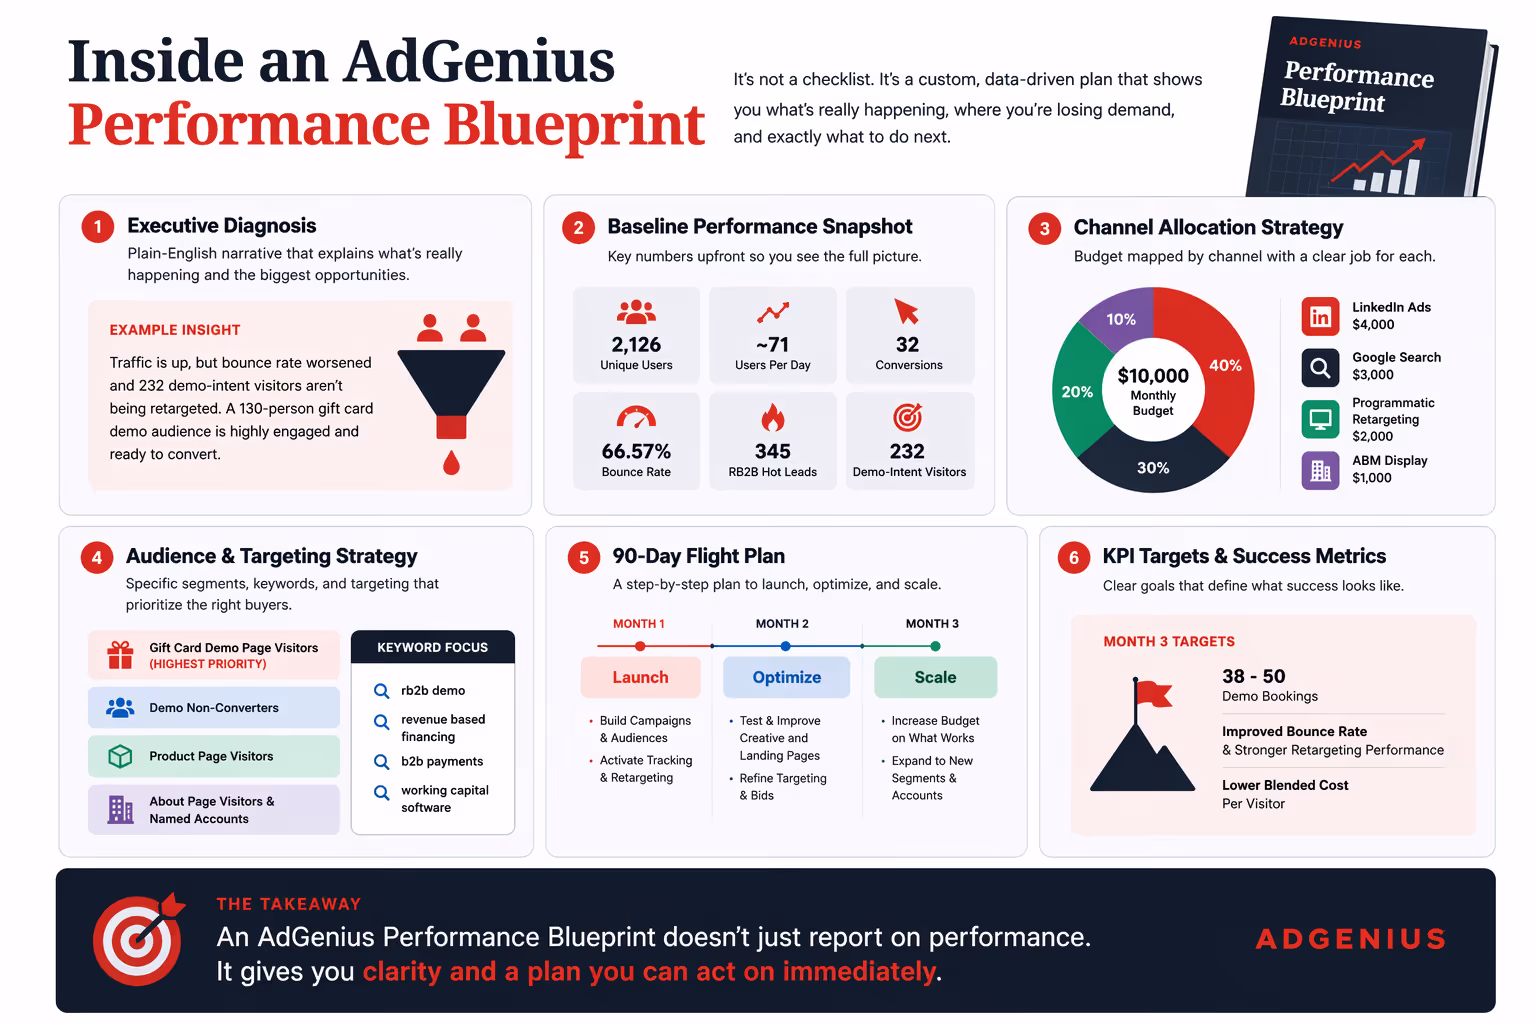
The Blueprint: What We Recommended
The Projected Outcome
By Month 3, the plan projected 35–48 demo bookings per month — more than triple the baseline of 14 — on a smaller total budget. The blended cost per visitor dropped to $6.49, compared to an estimated $11+ under the previous LinkedIn-heavy allocation.
The biggest driver was not any single channel. It was the shift from advertising on the platform where their buyer was supposed to be to advertising on the platforms where their buyer actually was. Meta delivered restaurant owner impressions at $11–14 CPMs. YouTube delivered demo video views at $0.04–$0.08 per view. Programmatic retargeting brought demo-page visitors back at $4.10 per click. And LinkedIn — still useful for ABM and retargeting named accounts — stopped being asked to carry the entire program.
The Lesson for Hospitality SaaS
If you are selling to restaurant owners, hotel GMs, vacation rental operators, or kitchen managers, your buyer is not a corporate VP reviewing software between Zoom calls. Your buyer is an operator who runs their business from their phone, discovers tools on Instagram and YouTube, evaluates them through peer recommendations and Google searches, and books demos late at night after the dinner rush.
Your paid media strategy should reflect that reality — not the B2B SaaS playbook you inherited from a company that sells to enterprise IT buyers.
The Performance Blueprint takes 15 minutes to set up and about a week to deliver. It connects your ad accounts, installs a pixel that identifies who is actually visiting your site, and shows you the channel-by-channel reality of where your budget should be going. For hospitality SaaS companies, that almost always means less LinkedIn, more Meta, more YouTube, more programmatic — and significantly more demos for every dollar spent.
Where are your hospitality buyers actually spending time?
The Performance Blueprint shows you the answer — and builds the plan to reach them there.
Book a Performance Blueprint