Something strange happens as enterprise marketing teams mature. They invest in ABM platforms. They build multi-touch attribution models. They adopt sophisticated lead qualification frameworks. They stand up revenue operations functions and hire analysts to build dashboards. And yet, when the CFO asks the simplest possible question... “Which campaigns actually created pipeline?”... the room goes quiet.
Not because nobody has an answer. Everyone has an answer. The problem is that they all have different answers, sourced from different systems, built on different assumptions, and none of them quite hold up under scrutiny.
This is the confidence gap in enterprise marketing. It doesn’t stem from a lack of technology or a shortage of data. It stems from a fundamental mismatch between what our measurement systems were designed to do (rack activity) and what leadership actually needs - isolate contribution.
And for demand generation leaders navigating this gap, the consequences are concrete: misallocated budgets, misunderstood channels, and a chronic inability to defend the programs that are actually working.
The Confidence Gap in Enterprise Marketing
Enterprise marketing measurement has never had more infrastructure supporting it. The average B2B tech stack now includes dozens of tools generating data at every stage of the funnel. CRM systems capture deal progression. Marketing automation platforms log every email open, form fill, and page view. Intent data providers signal when accounts are in-market. ABM platforms track account engagement scores.
And still, the numbers don’t agree.
A 2025 study of more than 700 B2B practitioners found that nearly 90% of respondents still rely on single-touch or basic multi-touch attribution models—the very models designed for simpler, faster buying cycles. Meanwhile, teams running account-based programs measure roughly 50% more metrics than non-ABM teams, averaging over five distinct measurement categories. More metrics, though, does not mean more clarity. It often means more noise.
The confidence gap shows up in predictable ways. Marketing presents a pipeline report to the CRO. Sales disputes the numbers because they see different data in the CRM. Finance questions whether influenced revenue is the same as sourced revenue. And the board wants a simple answer to a question that the current architecture cannot simply answer: what is working?
The teams with the most advanced tech stacks often have the least confidence in their pipeline numbers—not because they know less, but because they can see just how incomplete the picture really is.
The irony is that less mature teams sometimes feel more confident in their measurement, precisely because they can’t see what they’re missing. Once you start layering in multi-touch tracking, anonymous visitor data, buying group dynamics, and cross-channel engagement, the sheer complexity of the B2B buyer journey becomes impossible to ignore. And that complexity is growing. Recent benchmarks suggest the average B2B deal now involves over 60 touchpoints across multiple channels and stakeholders, with enterprise deals exceeding $100K requiring close to 5,500 impressions and more than 400 tracked interactions before closing.
Why Multi-Touch Environments Create False Precision
Multi-touch attribution was supposed to solve the attribution problem by distributing credit across every touchpoint in the buyer journey. In theory, it’s a massive improvement over first-touch or last-touch models that hand all the credit to a single interaction. In practice, it often creates a different kind of problem: the illusion of mathematical certainty applied to inherently uncertain data.
Here is where the false precision kicks in. A W-shaped model assigns 30% credit to first touch, 30% to lead creation, 30% to opportunity creation, and distributes 10% across everything in between. That sounds rigorous. But the model doesn’t actually know which of those touchpoints caused the buyer to progress. It assumes causality based on position in a sequence, not on influence. The webinar that happened to coincide with lead creation gets 30% credit whether or not the prospect actually attended or found it valuable.
This problem compounds rapidly in enterprise environments where buying committees include six, eight, or ten stakeholders, each on their own research path. A 2025 survey found that 91% of B2B marketers either focus solely on the primary decision-maker or fail to connect individual journeys within an account. That means attribution models are often measuring one person’s path through the funnel and projecting it onto a group decision.
The result is a pipeline story that looks precise on a dashboard but collapses under cross-examination. A VP of Demand Gen can present a slide showing that LinkedIn ads influenced 40% of Q3 pipeline. But if you ask what “influenced” means operationally—did someone from the buying committee click an ad, or did the account merely meet a threshold for ad impressions during the quarter?—the confidence evaporates.
Multi-touch attribution doesn’t tell you what caused pipeline. It tells you what happened to be near pipeline when it was created. That distinction matters enormously when you’re deciding where to put next quarter’s budget.
How Dashboards Create the Illusion of Understanding
Dashboards are seductive. They take messy, fragmented data and package it into clean visualizations that suggest comprehension. A well-designed BI dashboard with pipeline by channel, conversion rates by stage, and sourced-versus-influenced splits gives leadership the feeling that marketing measurement is under control.
But dashboards report what your systems captured, not what actually happened. And the gap between those two things is enormous.
Consider what a typical enterprise dashboard misses. It misses the 70–80% of prospect interactions that are anonymous—website visits before a form fill, content consumed but never tracked, internal conversations influenced by your brand but invisible to your analytics. It misses dark social: the Slack thread where a peer recommends your product, the podcast mention that prompted an executive to Google your company name, the LinkedIn post that shaped perception but generated no measurable click. Research consistently shows that attribution systems dramatically undercount channels like social media and podcasts despite their well-documented influence on revenue.
Dashboards also create what might be called the aggregation trap. When you roll up individual touchpoints into channel-level metrics—“LinkedIn generated $2.4M in influenced pipeline”—you lose all the contextual information that would help you understand why. Was it the targeting? The creative? The offer? The timing relative to the account’s buying stage? Channel-level reporting tells you where the activity happened, not what about that activity mattered.
The most dangerous version of this illusion is the executive summary that compares channels on influenced pipeline without accounting for how each channel was measured, what attribution windows were applied, or whether the same deal is being counted multiple times across platforms. Every ad platform claims credit for conversions using its own self-serving attribution model. When a buyer sees a Meta ad, clicks a Google search result, and converts through a LinkedIn retargeting campaign, each platform reports the conversion as its own. Without a unified view, you’re not measuring performance. You’re collecting competing narratives.
The Difference Between Reporting Activity and Understanding Causality
There is a critical distinction that gets lost in most enterprise measurement conversations: the difference between tracking activity and understanding causality.
Activity reporting tells you what happened. It shows that a prospect attended a webinar, clicked three emails, visited your pricing page, and then entered the pipeline 14 days later. Causality, on the other hand, would tell you which of those interactions actually moved the prospect closer to a buying decision—and which were incidental noise along the way.
Most enterprise marketing stacks are optimized for activity reporting. CRM records log touches. Marketing automation platforms timestamp engagement. ABM tools score accounts based on cumulative activity. All of this is useful for operations. None of it, by itself, establishes causality.
The distinction matters because it directly affects how you allocate budget. If your dashboard says webinars influenced $5M in pipeline last quarter, but those webinar attendees were already deep in an active buying cycle and would have progressed regardless, then reallocating budget toward webinars based on that data is a mistake. You’re rewarding correlation, not cause.
True causal understanding in B2B marketing is difficult to achieve at scale. It requires controlled experiments—holdout groups, geo-based tests, incrementality analysis—that most enterprise teams don’t have the infrastructure or organizational patience to run. But even without perfect experimental design, there is a meaningful middle ground: improving the campaign layer so you at least know what you’re measuring before you try to determine whether it’s working.
If you can’t see your campaigns clearly across channels, arguing about attribution models is like debating the best route on a map you haven’t drawn yet.
Why Campaign Truth Gets Lost Across Paid Channels
This is where the problem crystallizes for demand generation leaders in particular. The paid media landscape is more fragmented than it has ever been. A typical enterprise B2B advertising program now spans LinkedIn, Google Search, Google Display, Meta, YouTube, and increasingly channels like Reddit, TikTok, and connected TV. Each platform operates as a walled garden with its own tracking, its own attribution model, and its own incentives for how it reports performance.
The consequences are tangible. UTM taxonomy drifts. Campaign naming conventions diverge across platforms. Conversion events are defined differently on each channel. Look-back windows vary—Google might claim credit for a conversion within a 30-day window while LinkedIn uses a 90-day window for view-through attribution. The same buyer journey, viewed through two platform dashboards, tells two completely different stories.
Then layer in the organizational dimension. Different team members often manage different platforms. The Google Ads specialist sees Google’s data. The LinkedIn campaign manager sees LinkedIn’s data. The demand gen leader tries to reconcile them in a spreadsheet or BI tool and discovers that the numbers don’t add up, that pipeline is being double- or triple-counted, and that the channel mix looks completely different depending on which system you trust.
This is not a data science problem. It is a campaign architecture problem. When you can’t see what you’re running across platforms—when the same campaign has different names in LinkedIn Ads versus Google Ads versus your CRM—no attribution model on top of that fragmented foundation will produce trustworthy results. You are attempting precision measurement on a wobbly surface.
The Hidden Tax of Fragmented Campaign Visibility
The fragmentation tax is quiet but expensive. It shows up in three predictable ways:
Misallocated spend. Without clear cross-channel campaign visibility, budget flows toward whichever platform’s self-reported numbers look most compelling—which is usually whichever platform has the most generous attribution window, not whichever channel is actually driving pipeline progression.
Invisible retargeting gaps. When campaigns aren’t architected for cross-channel coordination, buyers who engage on one platform often see nothing from you on the next platform they visit. Those gaps in coverage represent lost impressions during active buying windows—moments you paid to create but failed to capitalize on.
Eroded executive confidence. When every QBR includes a caveat about data quality, when pipeline numbers always come with an asterisk, leadership gradually stops trusting marketing’s ability to measure itself. That loss of credibility has downstream consequences for budget requests, headcount, and strategic influence.
Why Fixing the Campaign Layer Matters More Than Arguing Over Metric Labels
There is a persistent temptation in enterprise marketing organizations to solve the measurement problem by changing the metrics. Shift from MQLs to MQAs. Adopt a revenue attribution model instead of a pipeline model. Move from sourced to influenced to blended. Every few years, a new framework promises to resolve the measurement debate.
These conversations have value. But they consistently miss the more foundational issue: if you cannot clearly see your campaigns across channels—if you don’t have a unified view of what you’re running, where you’re running it, and how those efforts connect to the buyer’s journey—then it does not matter what you call your metric. The data feeding it is unreliable.
Fixing the campaign layer means solving for visibility before you solve for attribution. It means building the infrastructure that allows you to see, in one place, every paid campaign running across every channel, so you can answer basic questions that should be trivial but currently are not: What are we spending across all platforms this quarter? Are our campaigns coordinated or operating in silos? Where are the gaps in our retargeting coverage? Which accounts are being reached, on which channels, at which stage of their buying journey?
Only once you have that visibility can attribution become a productive exercise rather than a political one. You stop arguing about whether marketing “sourced” or “influenced” a deal and start asking better questions: Are we reaching the right accounts with the right message at the right time across the channels they use? And are we doing it in a way that is coordinated, not chaotic?
Where This Is Heading
The next generation of campaign infrastructure will not be another attribution platform layered on top of fragmented data. It will be a visibility layer that sits across all paid channels and gives demand generation leaders a single, honest view of what they’re running—and what they’re missing.
This is not about replacing your CRM, your ABM platform, or your BI tool. It’s about fixing the input layer—the campaign data itself—so that everything downstream, from attribution to forecasting to executive reporting, starts from a foundation of truth rather than a patchwork of platform self-reports.
Because the teams that figure this out first will not just have better dashboards. They will have something far more valuable: the ability to actually answer the question that everyone in the boardroom is asking.
Before you redesign your qualification model, fix your ability to see what’s working.
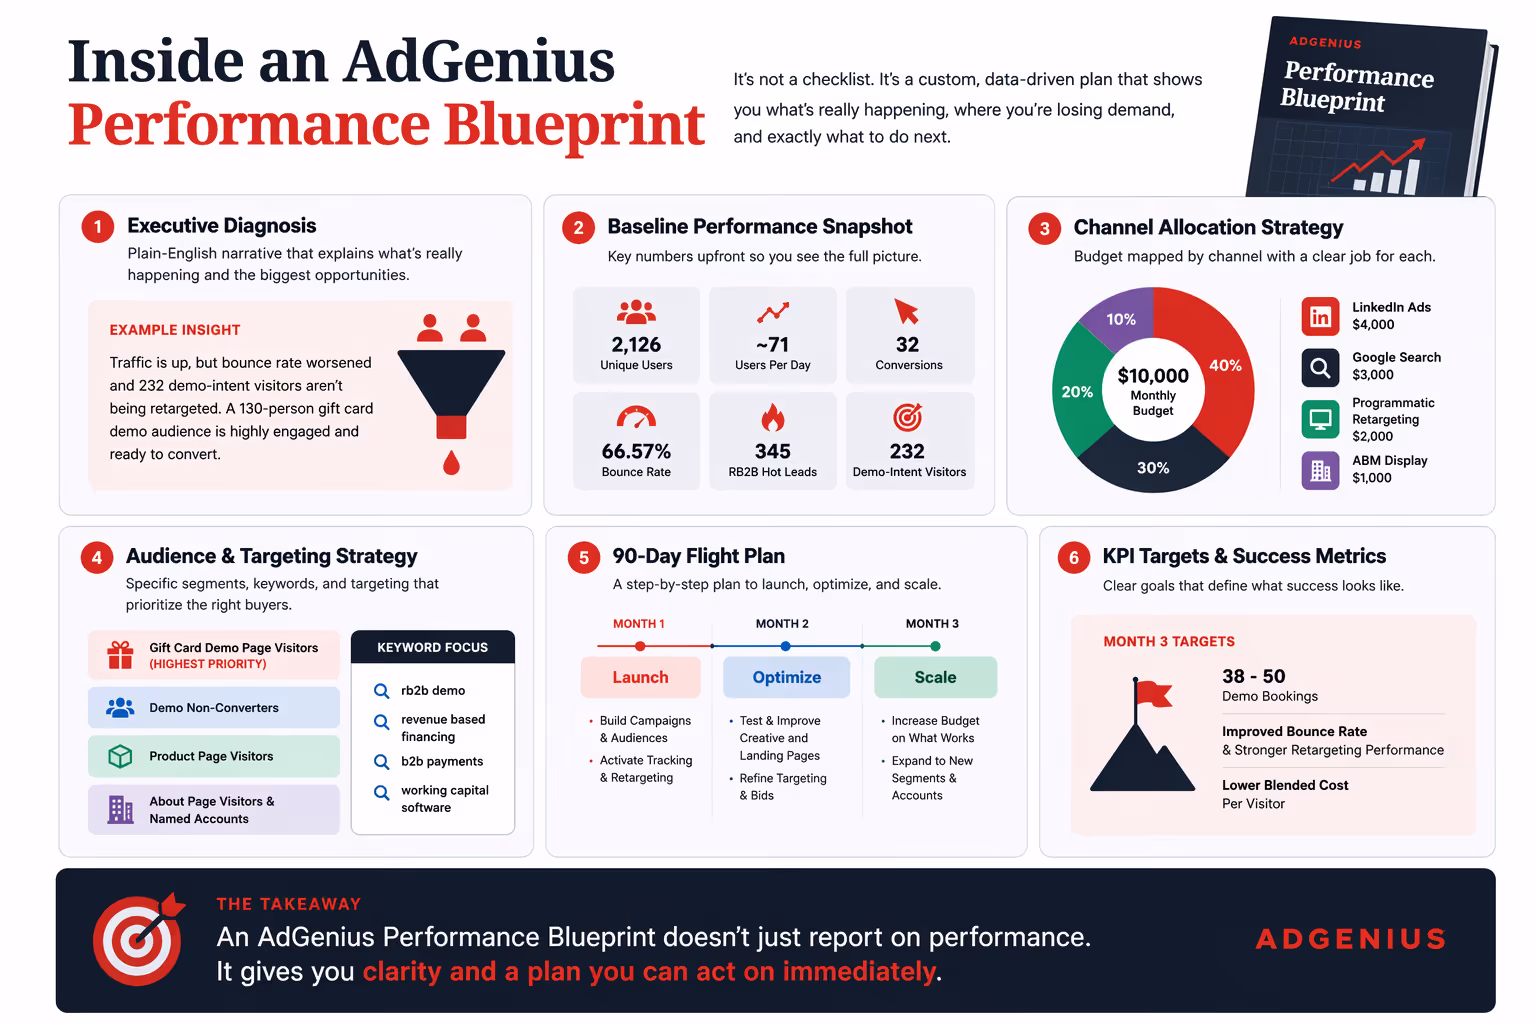
AdGenius gives demand generation leaders a single, cross-channel view of every paid campaign—across LinkedIn, Google, Meta, YouTube, TikTok, Reddit, and more—so you can stop reconciling platform dashboards and start making real decisions about pipeline.
See what you’ve been missing → leadgenius.com/adgenius