So, you have great products and a well-designed website that attracts visitors daily. Yet your conversion rates remain below average. Something is not working the way it should, but what is it? With multiple touchpoints in your sales funnel, you need to be able to see what the problems are.
Knowing how to conduct a sales funnel analysis can help identify (and fix) any issues and improve sales and conversion rates.
What is a Sales Funnel Analysis?

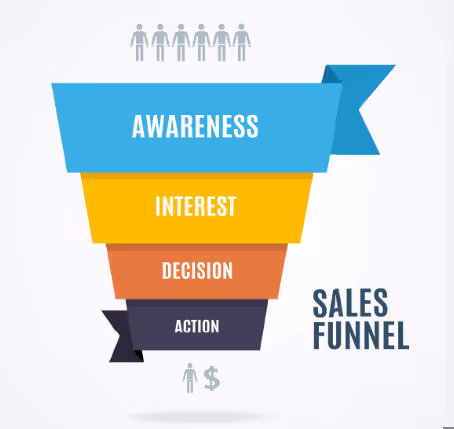
A sales funnel analysis involves collecting data from the various steps in your sales funnel that should drive visitors to your domain to take a desired action. You can use it to map the customer journey and optimize different steps to improve both it as well as overall conversion rates.
The main goal is to identify barriers to customers progressing through your funnel, then make needed changes. What does this look like in practice? MINDBODY is a brilliant case study to learn from.
The digital platform allows fitness enthusiasts to find and book classes and track their fitness goals through the app. After launching the Activity Dashboard, the team used a funnel analysis to determine what impact this new feature had on their conversion goal of booking classes.
The analysis showed that users who engaged with the dashboard booked 24% more classes per week. Plus, it revealed that users booked classes using their Book It Again button 4.5x more than other methods.
This led MINDBODY to feature the Activity Dashboard more prominently to further increase conversions but also gave them additional information about the effectiveness of particular buttons in the app.
How to Conduct a Sales Funnel Analysis
When conversion rates are lower than expected, you want to identify hurdles to conversion. Depending on your business model, the number of steps in your funnel may vary, but there are common things to look for.
Start by making a list of main customer touchpoints and steps where you want engagement to be at its highest. This makes any analysis more straightforward and thus it becomes quicker and easier to find solutions to issues. This applies whether your business operates a B2C or a B2B model.
Let’s look at the essential steps to conducting a sales funnel analysis.
- Use Heatmaps and Session Recordings

To spot where issues are arising, you need in-depth insights into what is happening before visitors leave without taking an action. Two great ways of doing this are by using heatmaps and session recordings.
- Heatmaps: Heatmaps allow you to see what steps someone takes immediately before leaving your site. Placing heatmaps on pages that are experiencing a high percentage of exits lets you analyze visitor behavior, from mouse clicks to scrolling. This allows you to see what elements of the page were clicked and how far down the page the visitor scrolled.
- Session recordings: These can offer you more context to the insights from heatmaps. Use them on the pages experiencing the highest incidence of exits so you can see exactly how visitors have interacted with buttons and content. This can help you zero in on issues and identify where you need to make improvements to your website’s UX design.
- Survey your Visitors
You may think that a funnel analysis would almost exclusively focus on quantitative data. However, much like seasonal reports, you need a mix of qualitative data in there too. After all, who better to pinpoint why visitors are not moving through your funnel than visitors themselves?
You may have already made some changes using methods like A/B testing. But perhaps those changes have not improved things as much as you’d like.
Collecting feedback from customers and site visitors should be a crucial part of your analysis. You can collect this data in different ways. You may decide on a pop-up survey on a particular web page or in your app. Or, if you have a sizable mailing list, you can conduct your survey by email.
You can also use social media tools, such as surveys or polls on your social media pages, to gather views from your visitors/customers and read existing reviews of your business.
Use a mixture of open and closed questions to get the most valuable insights. This can mean that you highlight specific issues and get an overview of how people feel about your site and sales funnel. The sort of questions you can ask include:
- Was there something specific that stopped you from buying?
- Do you feel anything was missing from the page?
- How can we improve the page or the sales process?
- Customer Segmentation
Chances are you’ve already segmented your customers for marketing and other purposes. Seeing how those different segments behave in your sales funnel can help identify if the issues are general or specific to those groups. You may already be using the best sales enablement tools, but do those tools suit everyone who visits your site?
Additionally, analyzing how different segments of sales leads progress through the funnel can provide valuable insights into their behavior and preferences.
You can also apply funnel segmentation. Look at the different points in your sales funnel and segment visitors according to where in that funnel they drop out. For example, you may find that people who sign up for a free trial don’t progress beyond a particular point. Identifying that drop-off point can help you improve the process.
- Visualization
Looking at endless streams of data can often be confusing. Just as you might use tools for automating sales, you should be looking at tools that let you visualize the sales funnel process.
A good funnel analysis tool can combine all the data you have collected and give you a visual representation of the overall process, making it easy to spot where there are issues.
Remember, the primary goal of conducting a sales funnel analysis is to gain actionable insights that allow you to improve the customer journey and boost conversion rates. Visualizing the funnel means you can improve areas where customers are experiencing problems or being put off progressing. You can also generate reports from your visualization tool and then optimize those problem areas.
The takeaway

People and behaviors change over time. If you notice a drop in your conversion rates compared to historical data or predictive forecasting, it’s an immediate red flag.
Your sales funnel is part of the customer journey – and a crucial one at that. By following the steps provided above, you can conduct a sales funnel analysis that gives you insights into customer behavior on your website, direct feedback from customers, and clear visuals of their journey through the funnel.
With this guide, you can improve conversions now while regularly monitoring your sales funnel to continuously grow in the future.