Here's a question that might sound absurd: When did spreadsheets become sacred texts?
I don't mean that metaphorically. I mean it literally. Walk into any successful company in 2026, and you'll find a priesthood that most people have never heard of. They don't have a name that makes immediate sense—Revenue Operations, or RevOps for short. They don't sit in the C-suite, usually. They're not the charming salespeople or the creative marketers. They're the ones in the back room, building something that looks, from the outside, impossibly boring: data infrastructure.
But here's what's wild: These people have more influence over whether your company lives or dies than almost anyone else in the building.
The RevOps market tells the story. From $3.45 billion in 2024 to a projected $10.25 billion by 2033. That's a 13.5% compound annual growth rate. To put that in perspective, that's faster than most of the "sexy" tech categories people actually talk about at dinner parties. This isn't a fad. This is infrastructure building. This is plumbing. And just like actual plumbing, nobody thinks about it until it breaks—and when it breaks, everything breaks.
So what exactly is happening here? Why is data infrastructure suddenly the hottest thing nobody's talking about?
The Thing That Changed Everything (And Nobody Noticed)
Let me tell you a story about how companies used to work, because it's a story about how they don't work anymore.
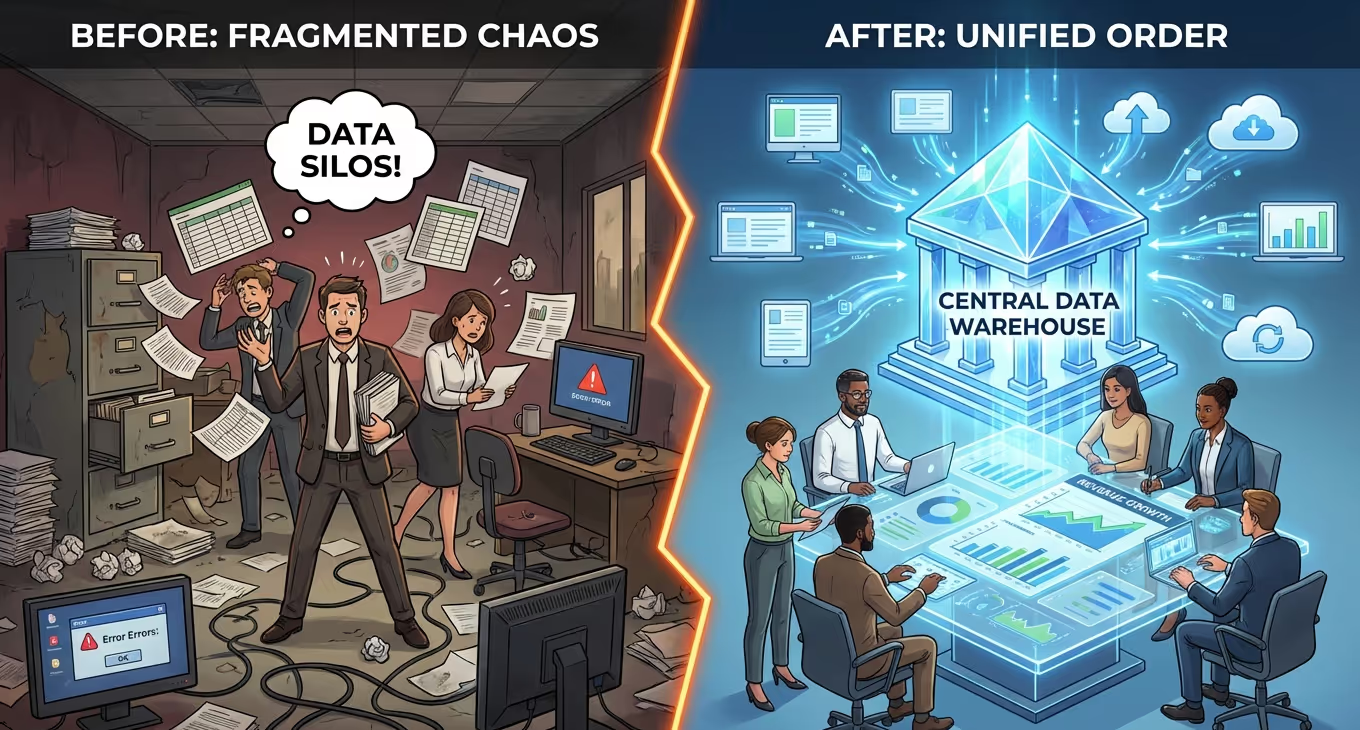
In 2015, if you wanted to know how your business was doing, you'd log into Salesforce. That was it. That was your "system of truth." Marketing lived in one tool. Sales lived in another. Customer success was probably using Excel, honestly. And everyone was reporting different numbers at the Monday meeting because everyone was measuring different things in different ways.
This was RevOps 1.0: The CRM-Centric Era. It was simple. It was siloed. And it worked about as well as you'd expect something held together with digital duct tape to work.
Then came RevOps 2.0, roughly 2019 to 2023. Companies got sophisticated. They bought business intelligence tools. They hired data analysts. They built attribution models that could tell you which marketing touchpoint led to which sale. In theory, this should have solved everything.
It didn't.
Because here's what nobody anticipated: The more tools you add, the more complex your data problem becomes. It's not a linear relationship. It's exponential. Every new integration is a new place for data to get lost, duplicated, transformed incorrectly, or just quietly break without anyone noticing until three months later when someone asks "Why do these numbers look weird?"
The data pipelines were fragile. The insights came too late. And everyone was still arguing about whose numbers were right.
Which brings us to now. RevOps 3.0: The Warehouse-Native Era.
This is where things get interesting.
The Architecture of Modern Revenue (Or: Why Your Company Is Now a Software Company, Even If You Sell Widgets)
The big shift—the thing that changed everything—is this: Companies stopped trying to make all their tools talk to each other directly. Instead, they built a central warehouse. One place where all the data lives, cleaned and standardized and queryable in near real-time.
It sounds simple. It's not.
Think of it like this: The old model was like having a bunch of filing cabinets in different departments, all using different organizational systems. If you wanted to know something, you had to physically go to each cabinet, translate each filing system, and manually compile a report.
The new model is like having one central library with one classification system. Everything flows into the library automatically. And instead of hiring people to run between filing cabinets, you hire people to ask better questions of the library.
The architecture has four layers, and I'm going to explain them in plain English because the technical jargon is designed to make you feel stupid (it's not your fault—it's the industry's fault).
Layer 1: Data Ingestion
This is the "get everything into one place" layer. Your CRM, your marketing tools, your billing system, your customer success platform, even your support tickets. All of it flows into the warehouse automatically. The key word is automatically. If humans are manually exporting and importing, you're already behind.
Layer 2: Data Normalization
This is the "make everything speak the same language" layer. Because here's a fun fact: If you ask Salesforce what a "customer" is and you ask your billing system what a "customer" is, you'll get different answers. Normalization fixes that. It's the reason you can actually trust your numbers.
Layer 3: Data Storage
This is the warehouse itself. Snowflake, BigQuery, Redshift—these are the names you'll hear. They're basically really, really good databases that can handle massive amounts of data and answer complex questions fast. The costs vary. The capabilities vary. But the principle is the same: One source of truth.
Layer 4: Data Modeling
This is where you organize the data into shapes that humans can actually use. Account hierarchies. Customer journeys. Revenue recognition schedules. This is where data becomes insight becomes action.
Here's what this solves: When everyone's looking at the same data, defined the same way, updated at the same time, you stop having meetings about whose numbers are correct. You start having meetings about what the numbers mean.
That shift—from "what is true" to "what do we do about what's true"—is worth millions of dollars. Sometimes billions.
Industry-Specific Infrastructure (Or: Why Your SaaS Company's Data Looks Nothing Like a Hospital's Data)
Here's where it gets really interesting: Not all businesses are the same. Obvious, right? But what's less obvious is how radically different their data infrastructure needs to be.
SaaS: The Subscription Obsession
If you're a SaaS company, you're essentially running a subscription-based casino. Your whole business model depends on getting people to stay, expand, and (ideally) never leave. Which means your data infrastructure is obsessed with:
- Monthly Recurring Revenue and how it moves
- Churn rates (who's leaving and why)
- Expansion revenue (who's buying more)
- Product usage (the leading indicator of everything)
The holy grail metric? Net Revenue Retention. It's the percentage of revenue you keep from existing customers, including expansions and minus churn. Target: 110% or higher. Meaning your existing customers are spending 10% more each year even before you add a single new customer.
Get this right, and you're building a compounding revenue machine. Get it wrong, and you're pouring water into a leaky bucket.
Healthcare: The Compliance Maze
Healthcare is the opposite of SaaS in almost every way. Sales cycles aren't measured in weeks. They're measured in quarters. Sometimes years.
Why? Because buying healthcare software involves:
- Getting approval from physicians
- Getting approval from administrators
- Getting approval from IT
- Getting approval from finance
- Getting approval from compliance
- Getting approval from several committees you didn't know existed
Your data infrastructure has to track all of this. Every stakeholder. Every committee meeting. Every piece of compliance documentation. HIPAA compliance isn't a checkbox—it's woven into every query you run.
The companies that succeed here don't just track deals. They track relationships. Multi-threaded engagements across dozens of decision-makers. It's account-based selling on steroids.
Fintech: The Real-Time Requirement
Fintech is interesting because the stakes are different. In SaaS, if your data is an hour old, that's fine. In fintech, if your transaction data is five minutes old, that might be too late.
Why? Because fintech is about money moving. And money moving means:
- Fraud detection (flag suspicious patterns immediately)
- Regulatory compliance (every transaction must be auditable)
- Risk assessment (who can transact and how much)
Your data infrastructure isn't just storing history. It's actively monitoring the present. Real-time alerts. Real-time dashboards. Real-time decision-making.
The companies that win here treat their data infrastructure like a trading floor, not like a reporting system.
Manufacturing: The Physical World Problem
Manufacturing is fascinating because it's where the digital world collides with the physical world.
You're not just tracking who bought what. You're tracking:
- Inventory levels across multiple warehouses
- Bill of materials for configured products
- Supply chain disruptions
- Production schedules
- Shipping logistics
Your quote-to-cash cycle isn't click a button and the product appears. It's check inventory, check lead times, get engineering approval, schedule production, coordinate shipping.
The data infrastructure has to bridge CRM (customer data), ERP (inventory and production), and supply chain systems. When done right, a salesperson can give a customer an accurate delivery date in real-time, accounting for every constraint in the system.
When done wrong, you're promising things you can't deliver and losing customers because of it.
The Implementation Playbook (Or: How to Actually Build This Thing Without Destroying Your Company)
Let's talk about implementation, because this is where most companies fail.
The mistake everyone makes: Trying to do too much too fast.
They see the vision. Data warehouse! AI-powered forecasting! Predictive analytics! They want it all immediately. So they spend six months building The Perfect System, launch it with great fanfare, and then... nobody uses it. Because it's too complex. Because the data's not clean enough. Because they didn't involve the actual users in the design.
Here's the better way:
Phase 1: Assessment (Weeks 1-4)
Figure out where you are and where you need to go. This sounds obvious. It's not. Most companies don't actually know all the data sources they have. They definitely don't know all the places where data quality is broken.
You need to audit everything. Document everything. And then—and this is key—make a decision about build vs. buy.
The honest truth: Unless you're a massive company with a dedicated data engineering team, you should buy, not build. Use Fivetran or Airbyte for connectors. Use dbt for transformations. Use a managed warehouse like Snowflake.
Why? Because the build-it-yourself path looks cheaper upfront. It's not. The ongoing maintenance will eat you alive.
Phase 2: Foundation (Weeks 5-12)
Set up the warehouse. Connect your most critical data sources. CRM first—always CRM first. Then marketing automation. Then billing.
But here's the critical thing: Start documenting your data quality from day one. What's complete? What's accurate? What's consistent? Set targets. Critical fields should be 95% complete. Start measuring against that immediately.
Phase 3: Analytics (Weeks 13-20)
Now you can start building the metrics that matter. ARR. Pipeline coverage. Conversion rates. Win rates.
But don't just build dashboards for executives. Build operational reports for the people doing the work. Sales reps need to see their pipeline. Marketers need to see campaign performance. Customer success needs to see health scores.
And here's the thing nobody talks about: The first version of every metric will be wrong. Not because you're bad at math, but because defining metrics is harder than it looks. What counts as a "qualified lead"? When does a deal actually close? How do you recognize revenue?
These are business questions, not technical questions. And you'll iterate on the answers for months.
Phase 4: Optimization (Weeks 21+)
This is where you get fancy. Predictive lead scoring. Churn risk models. Conversational analytics where you can ask your data questions in natural language.
But notice: This is Phase 4. Not Phase 1. You can't build predictive models on dirty data. You can't automate decisions when your foundation is shaky.
The companies that succeed do boring things well before they do exciting things at all.
The Technology Stack (Or: The Tools That Actually Matter in 2026)
Let's cut through the noise. There are approximately ten thousand RevOps tools. Here are the ones that actually matter:
Data Integration: Fivetran, Airbyte, or Switchboard. Pick one. They all do roughly the same thing—move data from your sources into your warehouse. Fivetran is the most polished. Airbyte is open-source and cheaper. Switchboard is newer and focused on real-time.
Data Transformation: dbt (data build tool). This is how you transform raw data into analytics-ready models. It's become the standard. Learn it.
Data Warehouse: Snowflake is the most popular, but it's expensive. BigQuery is great if you're all-in on Google. Redshift is fine if you're all-in on AWS. They're all good enough. Pick based on your ecosystem and budget.
Business Intelligence: Tableau, Looker, or Power BI. Again, they all work. Tableau is powerful but expensive. Looker is great if you have technical users. Power BI is great if you're a Microsoft shop.
Revenue Intelligence: This is the new category. Clari and Gong are the leaders. They use AI to analyze your deals, predict outcomes, and surface risks. If you're running a B2B sales org, you probably want one of these.
The key insight: Don't get overwhelmed by choice. The tools matter less than you think. What matters is:
- Integration (can they talk to each other?)
- Adoption (will people actually use them?)
- Support (can you get help when things break?)
Pick tools that check those boxes and move on.
Data Governance (Or: Why Having Data Is Pointless If Nobody Trusts It)
Here's the uncomfortable truth: Most companies have terrible data quality.
Not because their tools are bad. Not because their people are incompetent. But because nobody's job is data quality. Or everyone's job is data quality, which means it's nobody's job.
The data governance market is projected to grow from $5.38 billion in 2024 to $18.07 billion by 2032. Know what that means? A lot of companies are about to spend a lot of money fixing data they should have kept clean in the first place.
Here's what actually works:
Assign Owners: Every domain needs an owner. Someone who's accountable for marketing data. Someone who's accountable for sales data. Not just accountable for tools—accountable for quality.
Set Standards: Critical fields must be 95% complete. Important fields must be 90% complete. Measure this weekly. Make it visible. Celebrate wins.
Automate Validation: Don't rely on humans to catch errors. Build automated checks. Email addresses should have @ signs. Phone numbers should have the right number of digits. Duplicates should be flagged automatically.
Document Everything: Every field needs a definition. Every metric needs calculation logic. Every transformation needs documentation. Future you (and everyone who comes after you) will thank current you.
The companies with the best data aren't the ones with the fanciest tools. They're the ones with the clearest standards and the strongest culture of data quality.
Boring? Yes. Valuable? Extremely.
Metrics That Matter (Or: What You Should Actually Be Measuring)
Here's a secret: Most companies track too many metrics.
They have dashboards with 47 different numbers on them. Executives scroll past 46 of them to look at the one they actually care about. Everyone pretends this is fine.
It's not fine.
Here's what you actually need to know:
For SaaS Companies:
- Net Revenue Retention (are customers spending more over time?)
- CAC Payback Period (how fast do you earn back what you spent to acquire them?)
- LTV:CAC Ratio (are customers worth 3x what they cost? If not, fix that)
- Magic Number (how much ARR do you generate per dollar of sales and marketing spend?)
For All Companies:
- Pipeline Coverage (do you have enough pipeline to hit your targets?)
- Win Rate (what percentage of deals do you close?)
- Sales Cycle Length (how long does it take to close a deal?)
- Forecast Accuracy (how wrong are you, consistently?)
The common theme: These are metrics that tell you if your business model works. Not vanity metrics. Not lagging indicators you can't act on.
If a metric doesn't change how you make decisions, stop tracking it.
Common Failures (Or: How Companies Destroy Millions of Dollars Without Realizing It)
Let me tell you about the ways this goes wrong.
Tool Sprawl: Company buys best-of-breed tools. Each tool solves a specific problem beautifully. None of them talk to each other. Data lives in silos. Everyone reports different numbers. Meetings devolve into arguments about whose data is right.
Cost of failure: Millions in wasted software spend. Hundreds of hours in manual data reconciliation. Decisions made on incorrect data.
No Governance: Company builds infrastructure without standards. Everyone defines metrics differently. Nobody owns data quality. Six months in, nobody trusts the numbers.
Cost of failure: The infrastructure becomes expensive shelfware. Everyone goes back to Excel. You just wasted a year.
Premature AI: Company tries to build predictive models before cleaning their data. Models train on garbage. Predictions are worthless. Team loses trust in analytics.
Cost of failure: Months of engineering time. Loss of credibility. Resistance to future initiatives.
Building Without Users: Data team builds what they think users need. Launches with no input from actual users. Nobody uses it. Team blames users for "resistance to change."
Cost of failure: Failed project. Wasted investment. Demoralized team.
The pattern: Every failure comes from moving too fast or thinking technology alone solves the problem. It doesn't. Technology enables solutions. Humans create them.
The Maturity Model (Or: Where You Are and Where You Need to Be)
Most companies are at Level 2. They think they're at Level 3.
Level 1 (Ad Hoc): Everything is manual. Reports take days. Data quality is a mystery. You're flying blind.
Level 2 (Defined): Some automation exists. Basic dashboards. Regular reports. But still lots of manual work. Still lots of data quality issues.
Level 3 (Managed): Central warehouse. Automated pipelines. Self-service analytics. Users can answer their own questions. This is where most companies should aim.
Level 4 (Optimized): Predictive analytics. Automated workflows. Conversational interfaces. This is where the best companies are.
Level 5 (Innovative): AI-driven decisions. Fully automated operations. Industry-leading practices. This is the future, but very few companies are here yet.
Here's the thing: You don't need to be Level 5. Most companies get 80% of the value by getting from Level 2 to Level 3.
The jump from chaos to reliability is worth more than the jump from reliability to cutting-edge.
The 2026 Landscape (Or: What's Actually Changing Right Now)
Four trends are reshaping RevOps as we speak:
1. Conversational Analytics
Instead of dashboards, you'll ask questions in natural language. "Show me deals at risk of slipping this quarter." The system answers. No SQL required.
Is this revolutionary? Not really. It's UI improvement. But UI improvements matter. The easier something is to use, the more it gets used.
2. Adaptive Forecasting
Machine learning models that continuously update based on real-time data. They're already reducing forecast variance by 30-40%.
Is this magic? No. It's just math applied to more current data, more frequently. But it works.
3. Efficiency Metrics
Boards are done with "growth at all costs." Now it's "efficient growth." LTV:CAC ratios. Payback periods. The Rule of 40 (growth rate plus profit margin should exceed 40%).
Is this new? No. These metrics have existed for years. But they're finally getting the attention they deserve.
4. Data Governance as Strategy
Clean data is now a competitive advantage. AI doesn't work on dirty data. Companies with better governance ship better AI products faster.
Is this surprising? It shouldn't be. Garbage in, garbage out. But now there's money behind fixing it.
The Conclusion (Or: What All This Actually Means)
Here's what I've come to believe: RevOps isn't really about operations at all.
It's about trust.
When everyone in the company trusts the numbers, decisions happen faster. Finger-pointing stops. Strategy conversations become more sophisticated. You stop arguing about what happened and start arguing about what to do about it.
That shift—from data debates to strategic debates—is what separates winning companies from losing ones.
The best RevOps teams don't think of themselves as support functions. They think of themselves as internal product teams. Their product is data infrastructure. Their customers are every other team in the company. And their success metric is whether those customers can make better decisions because of what they built.
This is infrastructure work. It's not glamorous. Nobody's writing breathless profiles about the VP of RevOps. But infrastructure is what separates sustainable businesses from houses built on sand.
The RevOps market growing from $3.45 billion to $10.25 billion isn't a trend. It's a recognition of reality: In a world where every company is becoming a software company, your data infrastructure is your competitive moat.
Build it well, and you have a foundation for everything else. Build it poorly, and nothing else matters.
The question isn't whether to invest in RevOps. The question is whether you're willing to treat it like the strategic priority it actually is.
Most companies will say yes. Fewer will mean it. The ones that do will win.
Where to Start:
Stop reading guides (including this one). Start with an honest assessment of your current state. Document your data sources. Measure your data quality. Talk to your users.
Then pick one thing to fix. Not ten things. One.
Maybe it's connecting your CRM to a warehouse. Maybe it's standardizing your definition of a qualified lead. Maybe it's just documenting your current metrics.
One thing. Done well. Then the next thing.
RevOps isn't built in a quarter. It's built over years. But every journey starts with a single, boring, unglamorous first step.
Take it.